Honeywell AIR DETECTIVE Instructions


The system allows HVAC and environmental test professionals to take a snapshot of indoor air and connects them to an extensive allergen database to yield near real-time air quality analysis. The results help professionals to better inform their customers “on the spot” of present airborne particles and the products and services that may be useful in their homes.
The Honeywell Air Detective is intended for use by HVAC and environmental test professionals to analyze residential air quality for selected allergens including spores, specific pollen types, as well as other organic particles.
The Honeywell Air Detective system consists of three elements:
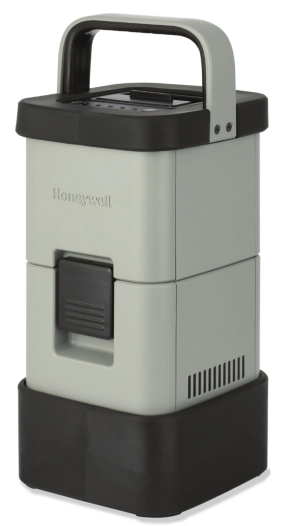
- The device and its associated hardware which collects the air samples and provides the particle holographic imagery to the cloud database for analysis.
- The cloud-based, machine-learning software which analyzes the detected particles and provides a particle report in near real-time.
- The user-supplied iPad tablet which controls the device application and the interface to the cloud, and also displays the particle report.
The device uses a fan to in-take and capture an air sample through the impaction sampler built into a single-use, disposable cassette. After sampling the air for three minutes, the device records holographic images of the particles detected in the air sample. These images are then sent to the cloud for on-the-spot, near real-time particle classification and display. See Table 2 for detailed performance characteristics of the device.

The Honeywell Air Detective device is only one part of the Honeywell Air Detective system. For a complete list of hardware, see Table 1.
The results are returned to the iPad, providing a particle analysis report to share with the homeowner in person and via e-mail. This data is intended to help HVAC professionals and homeowners make informed decisions about the types of air handling, cleaning equipment, and services that may be beneficial to the homeowner.
FEATURES AND BENEFITS


the app via e-mail.


DIFFERENTIATION
- Unlike particle sensors that only provide the volume of particles present and do not provide a picture and classification, or samplers that require analysis of air sampling cassettes in a remote lab, the Honeywell Air Detective provides on-the-spot
airborne particle analysis including visualization and classification - The portable Honeywell Air Detective, with cloud connectivity, enables the user to take advantage of imaging technology and algorithms that leverage artificial intelligence\
POTENTIAL APPLICATIONS
- Periodic service visits
- HVAC system diagnosis and consultation
- Collection of airborne allergen information to support marketing and sales
VALUE TO HVAC AND ENVIRONMENTAL TEST PROFESSIONALS
The Honeywell Air Detective is an innovative new tool for the test professional’s toolbox. The system enables the professional to provide preliminary insights into the customer’s indoor air, which will allow the customer to make more informed decisions about his/her HVAC system. This, in turn, may drive:
- Additional filters and upgraded air cleaning system sales during service visits
- Increased sign-up and renewal rate of HVAC service contracts
- Increased high-value web traffic to dealer home page with regularly updated pollen counts
- Where appropriate, additional testing of the homeowner’s indoor air
TABLE 1. HONEYWELL AIR DETECTIVE HARDWARE
| ITEM | QUANTITY | |
| • Honeywell Air Detective device • AC adapter power supply for external power • Power cord for external power |
1 each (included in case) | |
| Honeywell Air Detective single-use cassette | 18 Packaged in two clear plastic tubes containing nine cassettes each (included in case) | |
| Battery pack | Two sets of two (one set included in case, the other set provided separately) | |
| • Battery charging dock • AC adapter power supply • Power cord |
1 each (not included in the case, provided separately) | |
| Foam-lined, hardshell case which contains the components noted above | 1 |


Honeywell Air Detective Datasheet | sps.honeywell.com/ast |
HONEYWELL AIR DETECTIVE REPORT
The detailed Honeywell Air Detective Report provides particle concentrations, images, and categories, as well as size data. It also provides important information and helpful links to aid in interpreting the results. Figure 1 shows excerpts taken from a particle report that sampled the air in an indoor location, in this case, an office. See also Tables 2 and 3 for more information.
FIGURE 1. HONEYWELL AIR DETECTIVE REPORT EXCERPTS


TABLE 2. PERFORMANCE
CHARACTERISTIC |
PARAMETER |
| Collected airborne particle image | 8 megapixel reconstructed holographic image, grayscale |
| Collected particle minimum diameter1 | 2 µm typical |
| Field of view | 3.7 mm x 2.8 mm or 10.1 mm 2 |
| Typical particle collection efficiency2, 3 : >10 µm diameter 5 µm diameter 2.5 µm diameter |
|
| Precision % 4 : Detailed pollen classes as shown in Table 35 Spore class as shown in Table 35 |
91% typical 73% typical |
| % recall for spore class as shown in Table 36 | 74% typical |
| Air sampling time per reading | 3 min typical |
| Time to analyze one air sample reading in cloud7 | 3 min to 5 min typical |
1. The minimum diameter of detectable particles may actually be larger or smaller than 2 µm due to the refractive index and the opacity of the particle at the Honeywell Air Detective’s light source wavelength (i.e., 850 nm). In some cases, particles smaller than 2 µm may be detected due to high opacity; in other cases, larger translucent particles may not be detected.
2 . The collection efficiencies indicated are approximations that are derived not from empirical lab characterization, but rather from fluid dynamics models assuming 21 liter-per-minute sampling flow and certain other simplifications, including perfectly spherical particles. The collection efficiencies also assume the use of new cassettes that have been sealed and stored properly at room temperature.
3. The collection efficiencies are utilized in the calculation to translate the number of imaged particles to the average airborne particle concentration in #/m particles in a cubic meter of air). For example, a single 15 µm (with 100% collection efficiency) would translate to an approximate airborne particle concentration of 1 per 63 liters of air (or 16/m 3 (i.e., the estimated average number of likewise, a single 2.5 µm particle (20% collection efficiency) would translate to 5 per 63 liters of air (or 79/m3 ); 3 ).
4 The precision % values for detailed pollen classes and the spore class reflect the average percentage of correctly detected and correctly identified particles within each of the particle classes on which the machine-learning has been trained, based on a comparison between (1) Honeywell laboratory personnel’s analysis of certain particle images derived from lab-generated samples, and (2) the Honeywell Air Detective software’s analysis of those same images. In addition to providing information on these particle classes, the Particle Report also provides insight into (1) the total pollen particles detected (which includes pollen types other than the detailed pollen classes), and (2) the total non-pollen particles detected. Because the Honeywell Air detective’s machine-learning has not been trained on every type of pollen, spore, or another non-pollen/non-spore particle, and because of the high variability in the appearance of particles in the non-pollen/non-spore particle category, the precision % value is lower for total particles than it is for the detailed pollen class and spore class. The precision % values do not reflect or account for the existence of false negatives (i.e., where there has been a failure to detect a particle in the field of view). For the spore class, the % recall value described in more detail in Note 6 below is a measure of the probability of the Honeywell Air Detective machine-learning algorithms’ detection of particles presents within the field of view. Note that the precision % values may not reflect the performance of the Honeywell Air Detective in the field, in particular where a sample taken in the field includes types of particles on which the Honeywell Air Detective’s machine-learning has not been trained. Accordingly, the Honeywell Air Detective’s performance in the field may deviate, even significantly, from the precision % values indicated herein.
5 For comparison, an interpretation of the performance of the next best alternative (i.e., impaction sampling and off-line laboratory analysis by a trained technician) suggests that typical coefficient of variation (CV) (calculated as a ratio of the standard deviation to the mean particle concentration) ranges between 10% and 50%. See the following two references for further details on the CV of traditional methods:
1. J. Environ. Monit., 2007, 9, 855-861.
2. American Industrial Hygiene Association (AIHA) “FAQs About Spore Trap Air Sampling for Mold for Direct Microscopical
Examination – Mold Analysis Document”, 2020.
6 % recall is a standard machine-learning metric used to describe the probability that the Honeywell Air Detective’s algorithms will detect a spore present within the field of view (i.e., avoid a false negative). Recall is calculated using the following formula: (TP / [TP + FN]) * 100%, where TP = True Positive, and FN = False Negative. The % recall indicated was determined based only on the Honeywell Air Detective’s performance with respect to Aspergillus and Penicillium spores and is not indicative of its performance with respect to other spore types. To constitute a “true positive,” the machine-learning algorithm’s prediction must match both the location and identification of the sample analysis conducted by Honeywell laboratory personnel.
7 Highly dependent on the cellular connection of HVAC professional’s iPad (standard 3G or 4G service will result in typical analysis times). It is recommended that 2G cellular service be avoided due to much longer upload and download times.
TABLE 3. HONEYWELL AIR DETECTIVE REPORT
CHARACTERISTIC |
PARAMETER |
| Indoor sample particle concentration summary | Separate summaries for: • total pollen • total spores • non-pollen/non-spore particles |
| Outdoor sample particle concentration summary | Separate summaries for: • tree pollen • grass pollen • weed pollen • other (unspecified) pollen • spores • non-pollen/non-spore particles |
| Detailed pollen classes detected (indoor and outdoor | Eight classes from 11 pollen genera: • vernal + timothy grass (combined) • corn grass • rye grass + oak tree (combined) • pecan tree • pine tree • ragweed weed • plantain weed • pellitory + nettle weed (combined) |
| Spore class detected (indoor and outdoor) | • Aspergillus + Penicillium |
GENERAL SPECIFICATIONS
TABLE 4. GENERAL
CHARACTERISTIC |
PARAMETER |
| Operating temperature range | 0°C to 50°C [32°F to 122°F] |
| Operating humidity | 95% non-condensing, at 50°C [122°F], steady-state |
| Mains supply voltage fluctuations | not applicable |
| Pollution degree of the intended environment | Degree 2 |
| Device dimensions | 303 mm x 130 mm x 130 mm [11.9 in x 5.1 in x 5.1 in] |
| Approvals (provided by UL) | IEC/EN 60825-1, IEC/UL 61010-1 |
| Laser class | 1 |
IEC 60825-1:2014

TABLE 5. POWER SUPPLIES1
COMPONENT |
MANUFACTURER |
DESCRIPTION |
| Device DC voltage power supply | Cincon Electronics Co. LTD P/N: TR70MB120-01E02 VI |
12 V, 5.8 A adapter AC input is 80 VAC to 264 VAC |
| Device power cord | Cincon Electronics Co. LTD P/N: 223020-01 |
— |
| Honeywell Rechargeable lithium-ion battery pack 1 | Honeywell Model: CK65-BTSC P/N: 318-063-001 | nominal output: 3.6 V capacity: 7000 mAh, 25.2 Wh |
| Temperature ranges: operating (up to 30 days) storage (up to 30 days) charging | — | -20°C to 60°C [-4°F to 140°F] -20°C to 45°C [-4°F to 113°F] -20°C to 20°C [-4°F to 168°F] |
| CK3 Series Quad Battery Charger dock | Honeywell Model: AC20 P/N: 871-230-101 | charges four CK3 Honeywell Rechargeable lithium-ion battery packs |
| Battery charger power supply | Phihong 851-810-002 | — |
| Battery charger power cord | — | — |
| 1 See the documentation included with packaging for complete specifications, charging, and recommended use information. | ||
DISCLAIMERS
- Results obtained from the Honeywell Air Detective (HAD) are to be considered preliminary in nature, and a complete analysis of air quality or contaminants would require secondary laboratory analyses. The HAD should never be used as a basis to diagnose a disease or for any other healthcare or medical application. Honeywell makes no representation, warranty, or guarantee as to the accuracy of any detection, failure to detect, identification, or classification of any pollen, spore, or another particle by the HAD. Any recommendations or decisions with respect to products or services based on the HAD or its results should be made ith caution given the preliminary nature of the results.
- The HAD system is designed to improve over time through the advancement of its machine-learning algorithms and the availability and utilization of additional data sets. The product may be subject to inaccuracies, misidentification, false positives, or false negatives that impact the overall results provided in this report.
- The HAD is not the exclusive method of detecting, analyzing, or identifying pollens, spores, or other particles, and the data that is analyzed – a one-time “snapshot” of the immediately surrounding air in a given location – are not the exclusive source of data relative to particles that may be present. Distinct samples taken and analyzed by the HAD in the same location may have significant
FOR MORE INFORMATION
• Advanced Sensing Technologies services its customers through a worldwide network of sales offices and distributors. For application assistance, current specifications, pricing or the nearest Authorized Distributor, visit our website or contact: techsupport-variation in the types, classes, and numbers of particles detected. In addition, the particle report does not constitute a determination as to either the source or viability of any particles detected. The HAD cannot determine why a particle has been detected or predict whether such particle has been present in the past or will be present in the future. Given the HAD’s performance characteristics, the HAD and the report should not be used as the sole basis for a comprehensive indoor air quality assessment. Long-term, professional testing with laboratory analysis should be considered to obtain the most accurate assessment of indoor air quality and/or the causes of specific air quality concerns.
• Specific Comments Regarding Spores: The American Industrial Hygiene Association (AIHA) has cautioned that air sampling of spores alone cannot (1) support any definitive conclusions regarding the presence of mold in an indoor environment or (2) be used to assess potential health risks. Air sampling should be considered only as a tool used in support of an informed inspection. ee https://aiha-assets.sfo2.digitaloceanspaces.com/AIHA/resources/FAQs-About-Spore-TrapAir-Sampling-for-Mold-for-DirectExamination-Guidance-Document. pdf. A more detailed evaluation of the origin, identity, location, and/or extent of any spores identified by the HAD can be provided by a professional experienced in mold assessment and remediation. State law may require training, certifications, and/ or licenses in order to conduct mold assessment or remediation services. Where such laws apply, assessment or remediation should be carried out only by duly licensed and qualified professionals.
• It is buyer’s sole responsibility (1) to determine the suitability of the HAD for use in its application, (2) to operate the HAD in accordance with the user manual and any other
MISUSE OF DOCUMENTATION

- The information presented in this data sheet is for reference only.
Do not use this document as a product guide. - Complete operation and maintenance information is provided in the instructions supplied with the product.
Failure to comply with these instructions could result in death or serious injury.
- instructions provided by Honeywell (including, without limitation, disposal of the single-use cassette after each use), (3) to carefully review the particle report and accurately and completely communicate the contents of the report, and provide a full copy thereof, to the homeowner, and (4) to determine, based on buyer’s experience, expertise, and other available tools, the suitability of any product or service it may offer or recommend to the homeowner.
- Any recommendations or assistance provided by Honeywell regarding the use or operation of the HAD – through our literature, the Honeywell website, or otherwise – shall not be construed as representations or warranties of any kind, express or implied, and such information is accepted at the buyer’s own risk and without any obligation or liability to Honeywell.
- The information we supply in this data sheet is believed to be accurate and reliable as of this writing. However, specifications may change without notice, and Honeywell assumes no responsibility for its use.
- Honey well disclaims all implied warranties, including those of merchantability and fitness or a particular purpose. In no event shall Honeywell be liable for consequential, special, incidental, or indirect damages, or lost profits or lost revenues.
Honeywell
Sensing and Internet of Things
830 East Arapaho Road
Richardson, TX 75081
sps.honeywell.com/ast
007087-4-EN | 4 | 5/21
© 2021 Honeywell International Inc.
