Honeywell 32352460 Air Detective User Guide


HONEYWELL AIR DETECTIVE
USER GUIDE
Issue D
32352460

INTRODUCTION
The Honeywell Air Detective is intended for use by HVAC and environmental test professionals to analyze residential air quality for selected allergens including spores, specific pollen types, as well as other organic particles. The Honeywell Air Detective system consists of three elements:
- The device and its associated hardware collect the air samples and provide the particle holographic imagery to the cloud database for analysis.
- The cloud-based, machine-learning software which analyzes the detected particles and provides results report in near-real-time.
- The user-supplied iPad tablet controls the device application and the interface to the cloud and also displays the results report.
The device uses a fan to in-take and capture an air sample through the impaction sampler built into a single-use, disposable cassette. After sampling the air for three minutes, the device records holographic images of the particles detected in the air sample. These images are then sent to the cloud for on-the-spot, near-real-time particle classification and
display.
The results are returned to the iPad, providing an analysis report o share with the homeowner in person and via e-mail. This data is intended to help HVAC professionals and
homeowners make informed decisions about the types of air handling, cleaning equipment, and services that may be beneficial to the homeowner.

PRODUCT SAFETY INFORMATION
SIGNAL WORD DEFINITIONS
- WARNING: Indicates a potentially hazardous situation, which, if not avoided, could result in death or serious injury.
- CAUTION: Indicates a potentially hazardous situation, which, if not avoided, may result in property damage.
- NOTICE: Indicates important information that must be remembered and aids in job performance.
PRODUCT WARNING, CAUTION AND NOTICE STATEMENTS
WARNING
PERSONAL INJURY
- Ensure the laser safety interlock (laser stops when product is opened) is not defeated.

Failure to comply with these instructions could result in death or serious injury.
CAUTION
PRODUCT DAMAGE
Ensure the following:
- The Honeywell Air Detective system is used according to this User Guide.
- The Honeywell Air Detective device is used only in non-condensing locations.
- The Honeywell Air Detective components are not exposed to operating temperatures that exceed those found in Table 7.A (such as those found inside a parked vehicle during a hot day).
- The HAD device’s air inlet and outlet are kept clear at all times, including use in locations where fumes (such as kitchens) may clog the air inlet.
- The exposed glass in the cassettes is neither touched nor contaminated after the protective label is removed.
- The device imager is not touched except when it is cleaned (see Section 7.0).
Failure to comply with these instructions may result in product damage.
NOTICE
DEGRADED PRODUCT PERFORMANCE
- Before use, allow the device to acclimate to the ambient temperature.
- Perform air sample collection from 0°C to 38°C [32°F to 100°F] (non-condensing).
- Ensure the device remains closed while collecting air samples. Opening the device will disable the laser and fan, which terminates the sample.
- Ensure the sliding lid on the device remains closed at all times except when actually taking an air sample.
- Dirty, hazy, or otherwise visibly contaminated air may negatively impact test results.
- Although the device may be used outdoors, do not leave or store the device outdoors for long periods of time.
HARDWARE DESCRIPTION AND FUNCTION
HONEYWELL AIR DETECTIVE SYSTEM HARDWARE
Table 3. shows the Honeywell Air Detective system hardware. See Table 7. B for power supply specifications.
| ITEM
|
QUANTITY | |
| • Honeywell Air Detective device • AC adapter power supply for external power • Power cord for external power |
1 each (included in case) | |
| Honeywell Air Detective single-use cassette | 18 Packaged in two clear plastic tubes containing nine cassettes each (included in case) | |
| Battery pack | Two sets of two(One set included in case, the other set provided separately) | |
| • Battery charger dock • AC adapter power supply • Power cord |
1 each (not included in the case, provided separately) | |
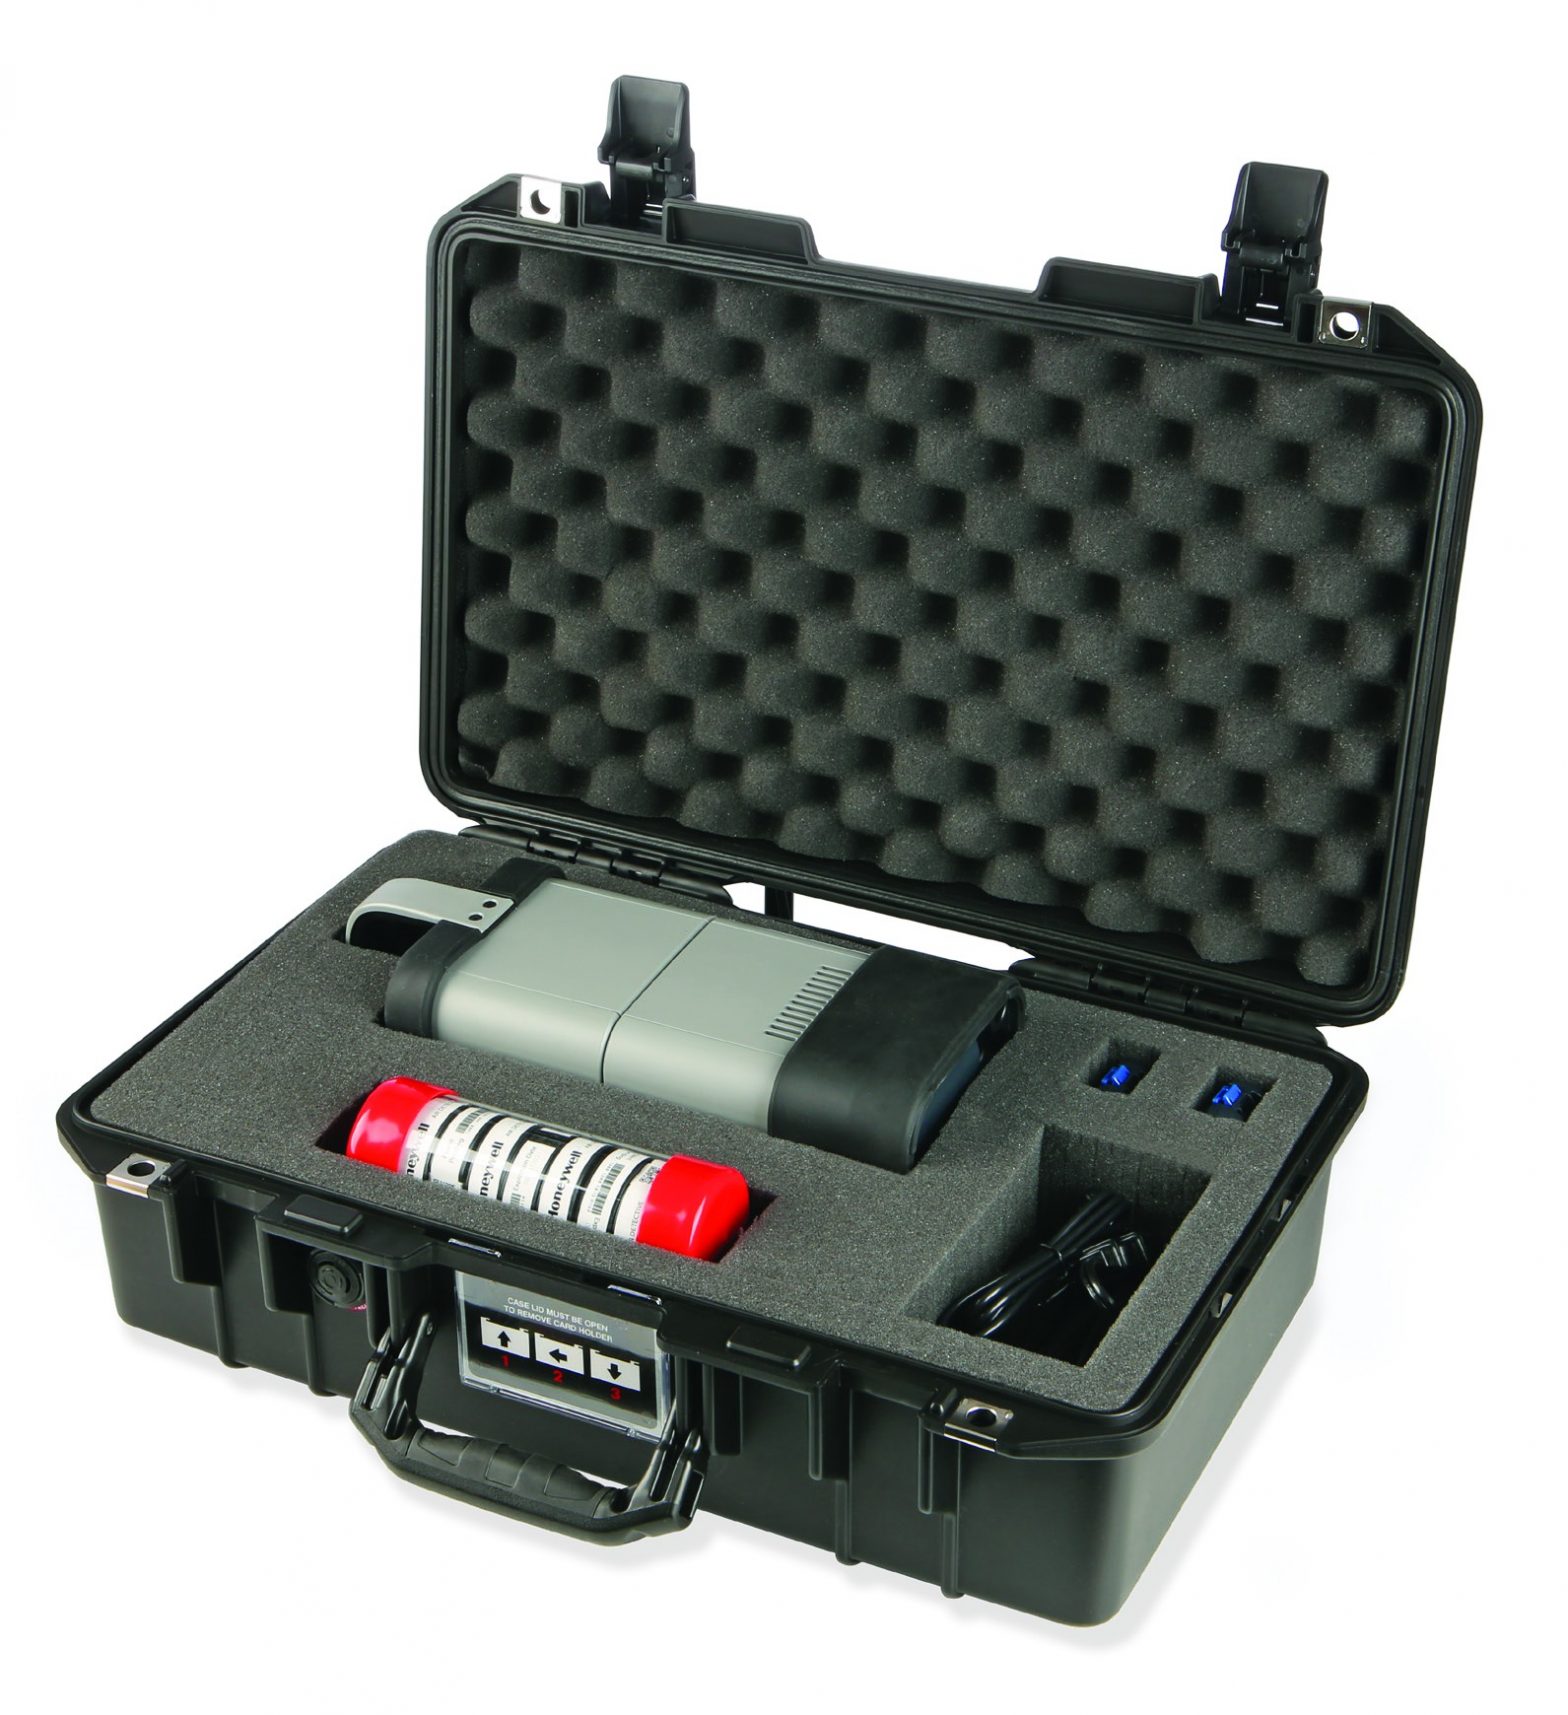
| The foam-lined, hardshell case which contains the components noted above | 1 | |


HARDWARE FEATURES (SEE FIGURES 3.A THROUGH 3.G, AND TABLE 3.A)
FIGURE 3.A. DEVICE EXTERNAL FEATURES


FIGURE 3.B. DEVICE INTERNAL FEATURES

FIGURE 3.C. CASSETTE FEATURES

NOTICE
- See the documentation included with the battery pack and the charger dock for complete specifications, charging, and recommended use information.
- New batteries come 50% charged and must be fully charged before use.
- Honeywell recommends using the external power option whenever possible but having four, fully-charged batteries available if needed.
- Batteries do not have the in-unit charging capability.
FIGURE 3.D. BATTERY PACK FEATURES

FIGURE 3.E. BATTERY CHARGER DOCK FEATURES

FIGURE 3.F. CASE FEATURES

FIGURE 3.G. CONTROL PANEL


STARTUP
CHARGE THE DEVICE BATTERIES
Insert the batteries into the charger dock and plug the charger dock into a wall outlet using the power cord.
POWER UP DEVICE
Insert the fully charged batteries into the bottom of the device, as shown in Figure 3.A, or plug the device into external power using the power supply and power cord. Depress the On/Off button (see Figure 3. A for location).
GET APP
Using your iPad, go to Apple App Store and search for Honeywell Air Detective.
Click “GET” to download the app.
REGISTER YOUR ACCOUNT ON THE HONEYWELL FORGE CLOUD
Open the Honeywell Air Detective app on your iPad. Enter your email address and click the “NEXT” button, as shown in Figure 4. A. FIGURE 4. A.
HONEYWELL FORGE SIGN IN SCREEN

Click the “CREATE AN ACCOUNT” button, as shown in Figure 4. B
FIGURE 4.B. CREATE AN ACCOUNT SELECTION-SCREEN

4Enter the requested information and click the “REGISTER” button, as shown in Figure 4.C. Your validation code will appear in your email inbox.
FIGURE 4.C. ACCOUNT REGISTRATION SCREEN

Enter your validation code and click the “CREATE ACCOUNT” button, as shown in Figure 4.D, to complete the Honeywell Forge Cloud account registration.
FIGURE 4.D. ACTIVATE ACCOUNT SCREEN

Click the “OK” button, as shown in Figure 4.E, to complete the registration validation and activate your account.
FIGURE 4.E. ACCOUNT ACTIVATED SCREEN

After you are redirected to the “End User License Agreement” screen, enter the optional company information and agree to the “End User License The agreement”. Click the “Register” option.
OPERATION
SIGN IN THE DEVICE AND PAIR IT WITH CLOUD
Enter your email or username, as shown in Figure 5. A, and click the “NEXT” button to pre-validate your sign-in to the device app.
FIGURE 5.A. SIGN-IN SCREEN: PRE-VALIDATION

After successful pre-validation, enter your credentials, as shown in Figure 5.B, and click the “SIGN IN” button,
FIGURE 5.B. SIGN-IN SCREEN: SIGN IN

Upon successful credential validation, you are then redirected to the device app homepage. Click the “START A READING” button, as shown in Figure 5.C.
FIGURE 5.C. DEVICE APPLICATION HOMEPAGE

Enter the client’s information, as shown in Figure 5.D, and click the “NEXT” button.
FIGURE 5.D. CLIENT INFORMATION TAB
Click the “+ Add Device” button, as shown in Figure 5.E, to open the QR code scanner.
FIGURE 5.E. DEVICE CONNECTION TAB
Using your iPad, scan the QR code located on the device, as shown in Figure 5.F. Click the “+ Add Device” button, previously shown in Figure 5.E, to initiate the QR Code scan.
FIGURE 5.F. ADD NEW DEVICE QR CODE SCREEN
Upon successful QR code validation, click the “JOIN” button, as shown in Figure 5. G, to connect your device to the app, as shown in Figure 5. H.
FIGURE 5.G. WI-FI PAIRING INITIALIZATION SCREEN
FIGURE 5.H. WI-FI PAIRING STATUS SCREEN
SELECT AIR SAMPLE LOCATIONS
After the device is connected to the app, select the “Device connection” tab, as shown in Figure 5.I, to begin making readings (collecting air quality samples).
FIGURE 5.I. DEVICE CONNECTION TAB
Click the “+ Add Location” button, as shown in Figures 5.J and 5.K, to add individual air sample locations.
FIGURE 5.J. ADD AIR SAMPLE LOCATIONS TAB
FIGURE 5.K. SELECT LOCATION OPTIONS SCREEN
PREPARE AND INSERT CASSETTE
Prepare a cassette for use by carefully removing the top and bottom protective labels, taking care to remove along the perforations so that the square QR code remains intact (see Figure 3. C).
With your iPad, scan in the cassette’s QR code, as shown in Figure 5. L.
FIGURE 5.L. SCAN CASSETTE TAB

Insert the cassette into the device as shown in Figure 5.M by aligning the cassette keyway with the device key, and gently, but firmly, seating the cassette. Note: If the cassette is difficult to insert or remove, see Figure 3.B for how to apply a lubricant.
FIGURE 5.M. INSERTING A CASSETTE INTO THE DEVICE

Each air sample location requires a fresh cassette. Select the “Scan Cassette” tab, as shown in Figure 5.N, to start the process.
MAKE READINGS (COLLECT AIR QUALITY SAMPLES)
Ensure the sliding lid on the device is open (see Figure 3. A).
Click the “START A READING” button to collect an air sample. One reading takes about five minutes after which the data is sent from the device to your iPad. If desired, you may continue to make readings for other locations, as shown in Figure 5. O and 5. P.
FIGURE 5.O. START DEVICE/START A READING SCREEN
FIGURE 5.P. READING IN PROGRESS STATUS SCREEN
GENERATE RESULTS AND VIEW PARTICLE REPORTS
After the desired reading(s) have been made, click the “GENERATE REPORT” button, as shown in Figure 5.Q. This action uploads the readings to the Honeywell Forge Cloud for analysis.
FIGURE 5. Q. GENERATE REPORT BUTTON
Upon successful report generation, you may view the particle report, as shown in Figures 5. R through 5.T.
FIGURE 5.R. REPORT GENERATION STATUS SCREEN 1
FIGURE 5.S. REPORT GENERATION STATUS SCREEN 2
FIGURE 5.T. FINAL PARTICLE REPORT SCREEN

If desired, you may share the generated reports via e-mail, as shown in Figures 5.U and 5.V.
FIGURE 5.U. SHARE REPORT SCREEN 1

FIGURE 5.V. SHARE REPORT SCREEN 2
To review past readings, click on the menu bars in the upper left corner and go to the “REPORT” tab, as shown in Figures 5. W and 5. X.
FIGURE 5.W. READINGS LOG
FIGURE 5.X. READINGS LOG
HONEYWELL AIR DETECTIVE REPORT
The detailed Honeywell Air Detective Report provides particle concentrations, images, and categories, as well as size data. It also provides important information and helpful links to aid in interpreting the results. Figure 6. A shows excerpts are taken from a particle report that sampled the air in an indoor location, in this case, an office. See also Tables 6. A and 6. B for more information.
FIGURE 6.A. HONEYWELL AIR DETECTIVE REPORT EXCERPTS

TABLE 6.A. PERFORMANCE
| CHARACTERISTIC | PARAMETER |
| Collected airborne particle image | 8 megapixel reconstructed holographic image, grayscale |
| Collected particle minimum diameter | 2 µm typical |
| Field of view | 3.7 mm x 2.8 mm or 10.1 mm² |
| Typical particle collection efficiency²³ | |
| >10 µm diameter | >90% |
| 5 µm diameter | approximately 50% |
| 2.5 µm diameter | approximately 20% |
| Precision % | |
| Detailed pollen classes as shown in Table 6. B | 91% typical |
| Spore class as shown in Table 6. B | 73% typical |
| % recall for spore class as shown in Table 6. B | 74% typical |
| Air sampling time per reading | 3 min typical |
| Time to analyze one air sample reading in cloud | 3 min to 5 min typical |
1The minimum diameter of detectable particles may actually be larger or smaller than 2 µm due to the refractive index and the opacity of the particle at the Honeywell Air detective’s light source wavelength (i.e., 850 nm). In some cases, particles smaller than 2 µm may be detected due to high opacity; in other cases, larger translucent particles may not be detected.
2The collection efficiencies indicated are approximations that are derived not from empirical lab characterization, but rather from fluid dynamics models assuming 21 liter-per-minute sampling flow and certain other simplifications, including perfectly spherical particles. The collection efficiencies also assume the use of new cassettes that have been sealed and stored properly at room temperature.
3The collection efficiencies are utilized in the calculation to translate the number of imaged particles to the average airborne particle concentration in #/m 3(i.e., the estimated average number of particles in a cubic meter of air). For example, a single 15 µm (with 100% collection efficiency) would translate to an approximate airborne particle concentration of 1 per 63 liters of air (or 16/m 3); likewise, a single 2.5 µm particle (20% collection efficiency) would translate to 5 per 63 liters of air (or 79/m
3).4The precision % values for detailed pollen classes and the spore class reflect the average percentage of correctly detected and correctly identified particles within each of the article classes on which the machine-learning has been trained, based on a comparison between (1) Honeywell laboratory personnel’s analysis of certain particle images derived from lab-generated samples, and (2) the Honeywell Air Detective software’s analysis of those same images. In addition to providing information on these particle classes, the Particle Report also provides insight into (1) the total pollen particles detected (which includes pollen types other than the detailed pollen classes), and (2) the total non-pollen particles detected. Because the Honeywell Air Detective’s machine-learning has not been trained on every type of pollen, spore, or another non-pollen/non-spore particle, and because of the high variability in the appearance of particles in the non-pollen/non-spore particle category, the precision % value is lower for total particles than it is for the detailed pollen class and spore class. The precision % values do not reflect or account for the existence of false negatives (i.e., where there has been a failure to detect a particle in the field of view). For the spore class, the % recall value described in more detail in Note 6 below is a measure of the probability of the Honeywell Air Detective machine-learning algorithms’ detection of particles present within the field of view. Note that the precision % values may not reflect the performance of the Honeywell Air Detective in the field, in particular where a sample taken in the field includes types of particles on which the Honeywell Air Detective’s machine-learning has not been trained. Accordingly, the Honeywell Air Detective’s performance in the field my deviate, even significantly, from the precision % values indicated herein.
5For comparison, an interpretation of the performance of the next best alternative (i.e., impaction sampling and off-line laboratory analysis by a trained technician) suggests that typical coefficient of variation (CV) (calculated as a ratio of the standard deviation to the mean particle concentration) ranges between 10% and 50%. See the following two references for further details on the CV of traditional methods: 1. J. Environ. Monit., 2007, 9, 855-861.
2. American Industrial Hygiene Association (AIHA) “FAQs About Spore Trap Air Sampling for Mold for Direct Microscopical Examination – Mold Analysis Document”, 2020.
6% recall is a standard machine-learning metric used to describe the probability that the Honeywell Air Detective’s algorithms will detect a spore present within the field of view (i.e., avoid a false negative). Recall is calculated using the following formula: (TP / [TP + FN]) * 100%, where TP = True Positive, and FN = False Negative. The % recall indicated was determined based only on the Honeywell Air Detective’s performance with respect to Aspergillus and Penicillium spores and is not indicative of its performance with respect to other spore types. To constitute a “true positive,” the machine-learning algorithm’s prediction must match both the location and identification of the sample analysis conducted by Honeywell laboratory personnel.
7Highly dependent on the cellular connection of HVAC professional’s iPad (standard 3G or 4G service will result in typical analysis times). It is recommended that 2G cellular service be avoided due to much longer upload and download times.
TABLE 6.B. HONEYWELL AIR DETECTIVE REPORT
| CHARACTERISTIC | PARAMETER |
| Indoor sample particle concentration summary | Separate summaries for: • total pollen • total spores • non-pollen/non-spore particles |
| Outdoor sample particle concentration summary | Separate summaries for: • tree pollen • grass pollen • weed pollen • other (unspecified) pollen • spores • non-pollen/non-spore particles |
| Detailed pollen classes detected (indoor and outdoor) | Eight classes from 11 pollen genera: • vernal + timothy grass (combined) • corn grass • ryegrass + oak tree (combined) • pecan tree • pine tree • ragweed weed • plantain weed • pellitory + nettle weed (combined) |
| Spore class detected (indoor and outdoor) | • Aspergillus + Penicillium |
GENERAL SPECIFICATIONS
TABLE 7. A. GENERAL
| CHARACTERISTIC | PARAMETER |
| Operating temperature range | 0°C to 50°C [32°F to 122°F] |
| Operating humidity | 95% non-condensing, at 50°C [122°F], steady-state |
| Mains supply voltage fluctuations | not applicable |
| Pollution degree of the intended environment | Degree 2 |
| Device dimensions | 303 mm x 130 mm x 130 mm [11.9 in x 5.1 in x 5.1 in] |
| Approvals (provided by UL) | IEC/EN 60825-1, IEC/UL 61010-1 |
| Laser class | 1 |

TABLE 7.B. POWER SUPPLIES1
| COMPONENT | MANUFACTURER | DESCRIPTION |
| Device DC voltage power supply | Cincon Electronics Co. LTD P/N: TR70MB120-01E02 VI |
12 V, 5.8 A adapter AC input is 80 VAC to 264 VAC |
| Device power cord | Cincon Electronics Co. LTD P/N: 223020-01 |
— |
| Honeywell Rechargeable lithium-ion battery pack1 | Honeywell Model: CK65-BTSC P/N: 318-063-001 |
nominal output: 3.6 V capacity: 7000 mAh, 25.2 Wh |
| Temperature ranges: operating (up to 30 days) storage (up to 30 days) charging | — | -20°C to 60°C [-4°F to 140°F] -20°C to 45°C [-4°F to 113°F] -20°C to 20°C [-4°F to 168°F] |
| CK3 Series Quad Battery Charger dock 1 | Honeywell Model: AC20 P/N: 871-230-101 |
charges four CK3 Honeywell Rechargeable lithium-ion battery packs |
| Battery charger power supply | Phihong 851-810-002 |
— |
| Battery charger power cord | — | — |
1See documentation included with packaging for complete specifications, charging, and recommended use information.
TABLE 7.C. IPAD TABLET REQUIREMENTS
| CHARACTERISTIC | PARAMETER |
| iOS version | iOS 9.0+ |
| iPad versions | • iPad 2, iPad 3, iPad 4, iPad Air, iPad Air 2, latest iPad and iPad Air • iPad mini, iPad mini 2, iPad mini 3, latest iPad mini |
| Other requirements | • Wi-Fi enabled • Camera enabled and access granted • Location access granted • Cellular enabled if the internet is unavailable through Wi-Fi • Minimum 200 MB of space |
MAINTENANCE
Cleaning (See Figure 8.A):
- Device: Remove the air conduit and use compressed air to remove debris from the air intake vents, air conduit, and imager window.
- Imager window: To remove fingerprints and other contamination, use Uvex®Clear® Non-Abrasive Pre-Moistened Lens Cleaning Tissues to carefully wipe the imager window. Use minimal pressure to avoid cracking the glass window.
Storage:
- Store the device inside a plastic bag to keep out dust. If not stored properly for prolonged periods, ensure the device is cleaned before use.
- Remove the batteries from the device if stored for prolonged periods.
FIGURE 8.A. CLEANING LOCATIONS IN THE DEVICE

TROUBLESHOOTING
See Tables 9. A and 9. B for common troubleshooting information. For technical support, email .
TABLE 9. A. TROUBLESHOOTING GUIDELINES
| PROBLEM | REMEDY |
| Autoexposure error fault | Ensure that the laser path (path from the imager to the cassette) is not blocked.. |
| iPad app freezes, hangs up, and reports an error. | “Force-quit” the application: 1. Double click the iPad’s home button and swipe up on the app tile. 2. In the iPad’s Wi-Fi settings manually “forget” the Allergen Wi-Fi address. |
| iPad app displays “JSON Error” during an air sample reading. | Reboot the device and the app: 1. Shut down the device by holding down the power button. 2. Power the device back on by pressing the power button. 3. Force quit the app by double-clicking the iPad’s home button and swiping up on the app tile |
| An error code listed in Table 9.2 may appear if there is an error with the cloud-based artificial intelligence. | Note: If other error messages are displayed or if the app does not start correctly, “force quit’ the application, as explained above, and reopen the app.. 1. Reboot the device and the app. |
TABLE 9.B. ERROR CODES
| ERROR CODE | DEFINITION |
| 1 – INVALID_INPUT_ARGS | Input command line arguments are not valid. |
| 2 – BACKGROUND_FILE_NOT_FOUND | The background image was not found at the provided path. |
| 3 – BACKGROUND_WRONG_SIZE | The background image is not the same size as the input image. |
| 4 – BACKGROUND_FOV_OBSCURED | The background is obscured by debris. |
| 5 – BACKGROUND_MEAN_INTENSITY_TOO_LOW | Background mean intensity is too low. |
| 6 – BACKGROUND_MEAN_INTENSITY_TOO_HIGH | The background mean intensity is too high. |
| 7 – BACKGROUND_NOT_UNIFORM | The background is not uniform enough. |
| 8 – IMAGE_FILE_NOT_FOUND | Input image was not found at the provided path. |
| 9 – IMAGE_FOV_OBSCURED | Image is obscured by debris |
| 10 – GLOBAL_FOCUS_NOT_FOUND | Global best focus distance was not found in the selected range. |
| 11 – MEM_ALLOC_ERROR | Memory allocation failed. |
DISCLAIMERS
- Results obtained from the Honeywell Air Detective (HAD) are to be considered preliminary in nature, and a complete analysis of air quality or contaminants would require secondary laboratory analyses. The HAD should never be used as a basis to diagnose a disease or for any other healthcare or medical application. Honeywell makes no representation, warranty, or guarantee as to the accuracy of any detection, failure to detect, identification, or classification of any pollen, spore, or other particle by the HAD. Any recommendations or decisions with respect to products or services based on the HAD or its results should be made with caution given the preliminary nature of the results.
- The HAD system is designed to improve over time through the advancement of its machine-learning algorithms and the availability and utilization of additional data sets. The product may be subject to inaccuracies, misidentifications, false positives, or false negatives that impact the overall results provided in this report.
- The HAD is not the exclusive method of detecting, analyzing, or identifying pollens, spores, or other particles, and the data that is analyzed – a one-time “snapshot” of the immediately surrounding air in a given location – are not the exclusive source of data relative to particles that may be present. Distinct samples taken and analyzed by the HADin the same location may have a significant variation in the types, classes, and numbers of particles detected. In addition, the particle report does not constitute an etermination as to either the source or viability of any particles detected. The HAD cannot determine why a particle has been detected or predict whether such particle has been present in the past or will be present in the future. Given theHAD’s performance characteristics, theHAD and the report should not be used as the sole basis for a comprehensive indoor air quality assessment. Long-term, professional testing with laboratory analysis should be considered to obtain the most accurate assessment of indoor air quality and/or the causes of specific air quality concerns.
Specific Comments Regarding Spores: The American Industrial Hygiene Association (AIHA) has cautioned that air sampling of spores alone cannot (1) support any definitive conclusions regarding the presence of mold in an indoor environment or (2) be used to assess potential health risks. Air sampling should be considered only as a tool used in support of an informed inspection. See https://aiha-assets.sfo2. digitaloceanspaces.com/AIHA/resources/FAQsAbout-Spore-Trap-Air-Sampling-for-Mold-forDirect-Examination-Guidance-Document.pdf. A more detailed evaluation of the origin, identity, location, and/or extent of any spores identified by the HAD can be provided by a professional experienced in mold assessment and remediation. State law mayrequire training, certifications, and/ or licenses in order to conduct mold assessment or remediation services. Where such laws apply, assessment or remediation should be carried out only by duly licensed and qualified
professionals.- It is the buyer’s sole responsibility (1) to determine the suitability of the HAD for use in its application, (2) to operate the HAD in accordance with the user manual and any other instructions provided by Honeywell (including, without limitation, disposal of the single-use cassette after each use), (3) to carefully review the particle report and accurately and completely communicate the contents of the report, and provide a full copy thereof, to the homeowner, and (4) to determine, based on buyer’s experience, expertise, and other available tools, the suitability of any product or service it may offer or recommend to the homeowner. Any recommendations or assistance provided
- by Honeywell regarding the use or operation of the HAD – through our literature, the Honeywell web site, or otherwise – shall not be construed as representations or warranties of any kind, express or implied, and such information is accepted at buyer’s own risk, without any obligation or liability to Honeywell, and Honeywell assumes no responsibility for its use. The information we supply in this user manual
- is believed to be accurate and reliable as of this writing. However, Honeywell may update the user manual from time to time. Honeywell disclaims all implied warranties,
including those of merchantability and fitness for a particular purpose. In no event shall Honeywell be liable for consequential, special, incidental, or indirect damages, or lost profits, or lost revenues.
Honeywell
Advanced Sensing Technologies
830 East Arapaho Road
Richardson, TX 75081
sps.honeywell.com/ast
32352460-D-EN | D | 5/21
© 2021 Honeywell International Inc. All rights reserved.
Honeywell Air De